
Bullish Case for Google to rise 50% in next 12 months
Preface: I originally published this on May 11. The headline read “The Bullish Case for Google to double in next 12 months to $301.” I unpublished it but it is sitting in your inbox if you were a subscriber at the time. For the sake of being sanguine but not being considered delirious, I have tempered the potential to $246 or 50% from the April 26 gap. This is never financial advice, just my observations.
No #AI was used in this piece. Just my mortal human brain and 20/20 vision.
I invite you to look into this crystal ball. Maybe it is nothing. Maybe it is the potential for Alphabet to rise 50% in 12 months. This is not a forecast. Simply a zoomed in look into this chart below for my paying subscribers.
There will be a review of this chart on May 1 of 2025 to see if this came to fruition, or if GOOG has sold off.
I will be using Class C ticker GOOG 0.00%↑ since it trades pretty close in parity with the Class A shares.
Pre-requisite before proceeding.
Market Profile 101

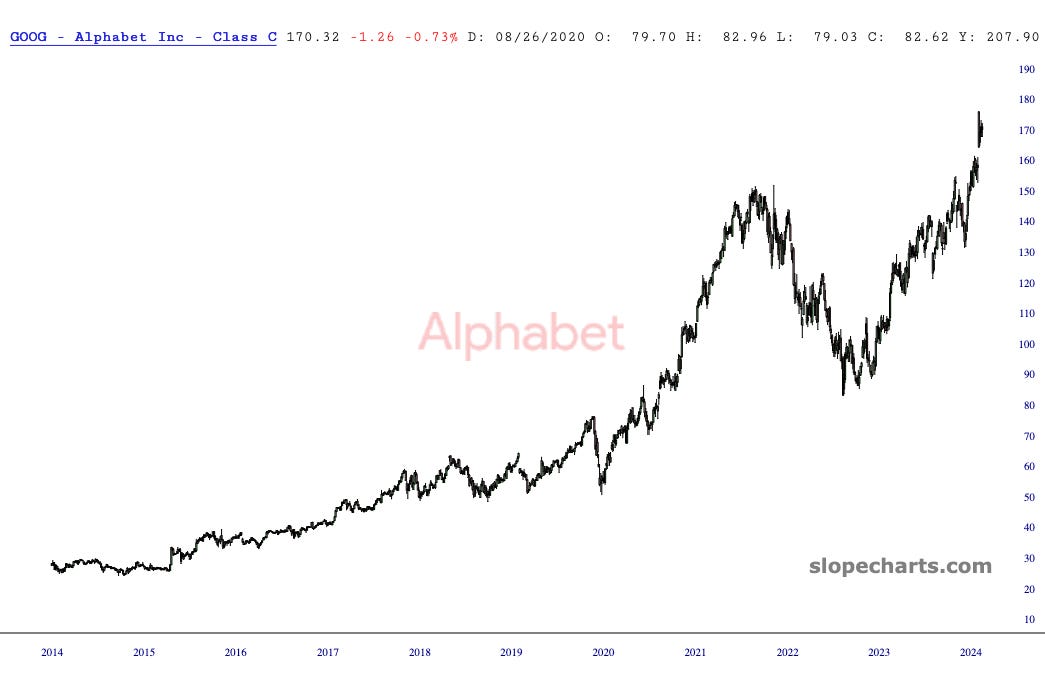
Ok. Lets dig in and look at the entire chart (Linear graph scale). I have taken the liberty of coloring the balance areas in different colors so you can better differentiate each.
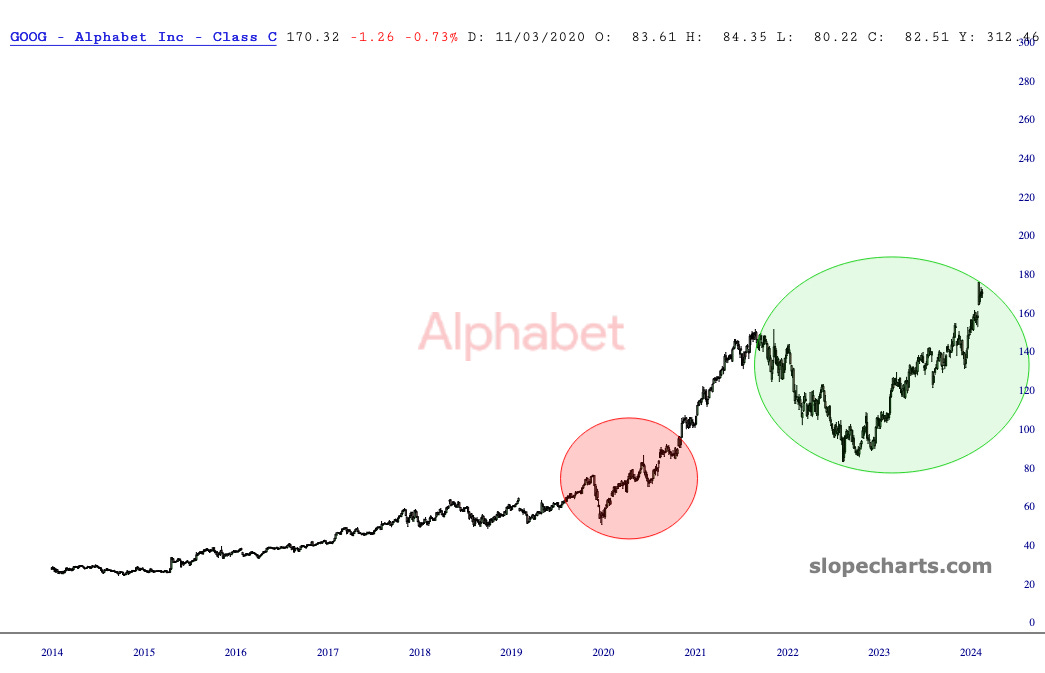
As I have noted, I have a semi photographic memory and one thing that stood out to me like a ton of bricks was the Pandemic V bottom in 2020 and the gap higher in September of the same year.
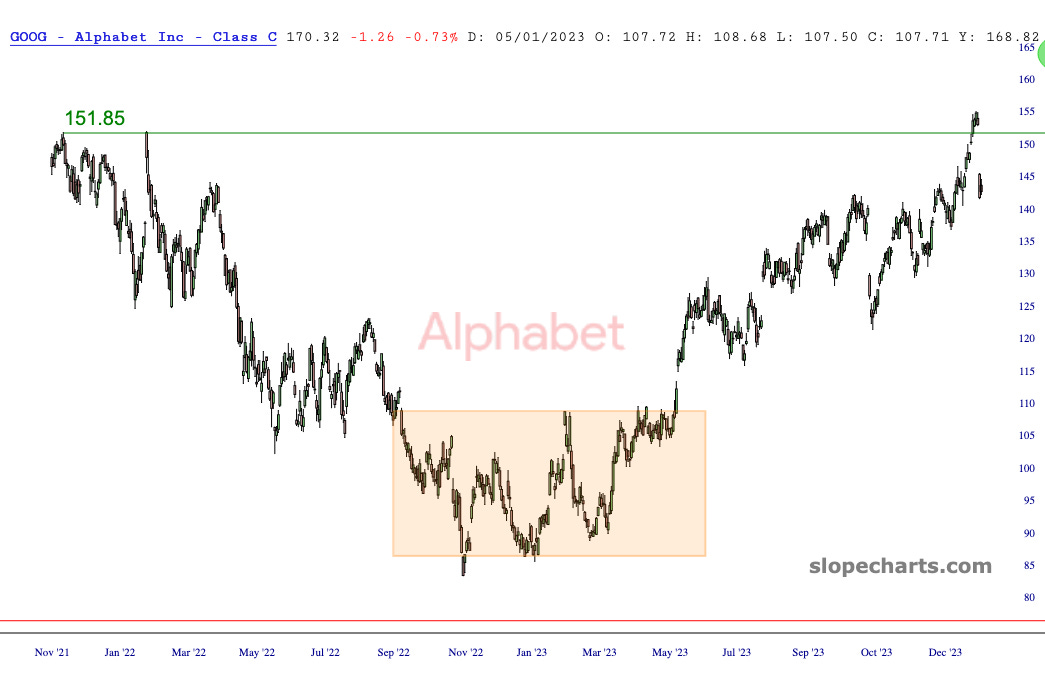
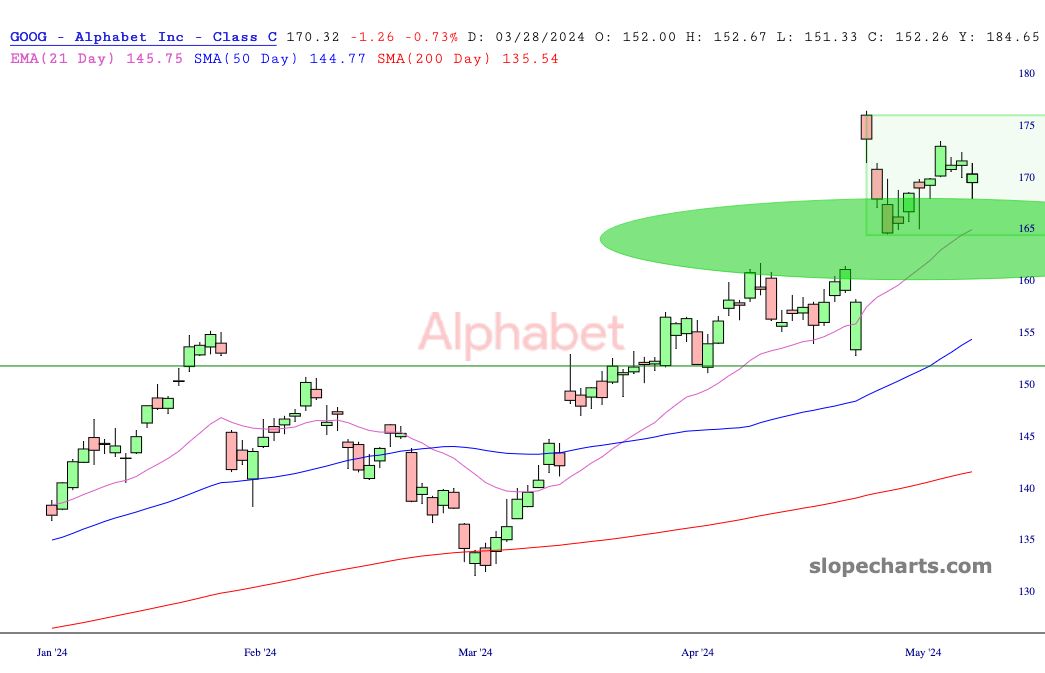
Now gaze at the much larger V of 2021 to 2024. It broke out just like 2020 and here we are seeking a new range where traders can all agree, and where the markets can facilitate the largest time spent and volume of transactions.
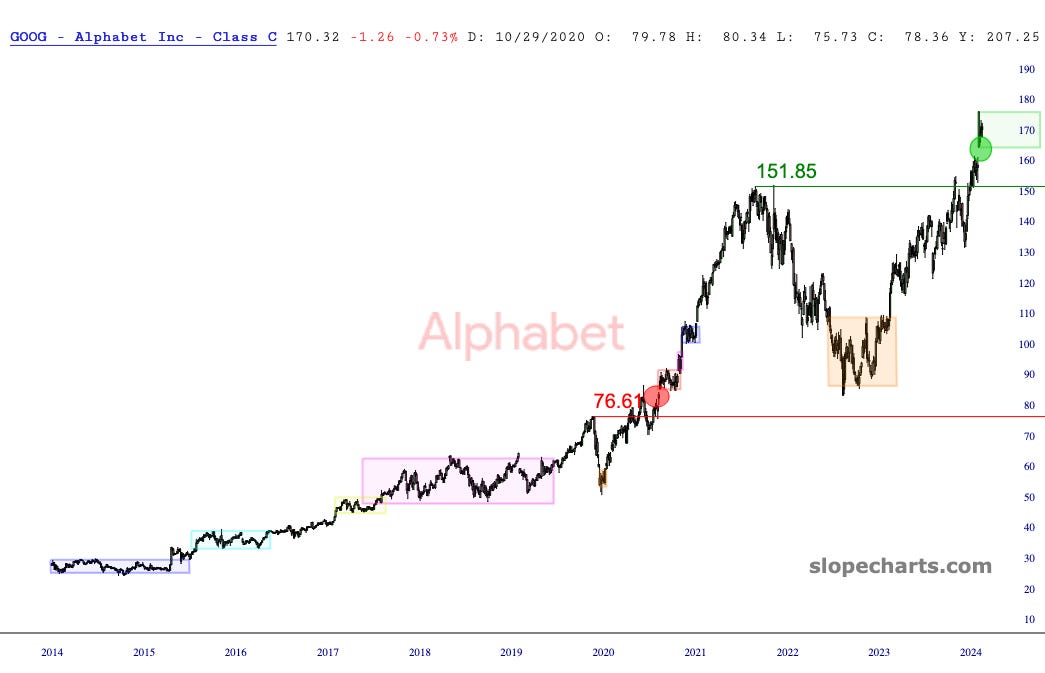
(Exhibit 1)
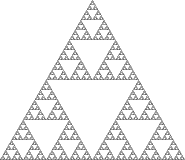
This is what you would call a fractal pattern. Identical looking pattern but different range of dollar unit and range of time.
Here are my take aways
Auction market principles works. I have shared countless charts of many stocks in various time frames with my paid subscribers
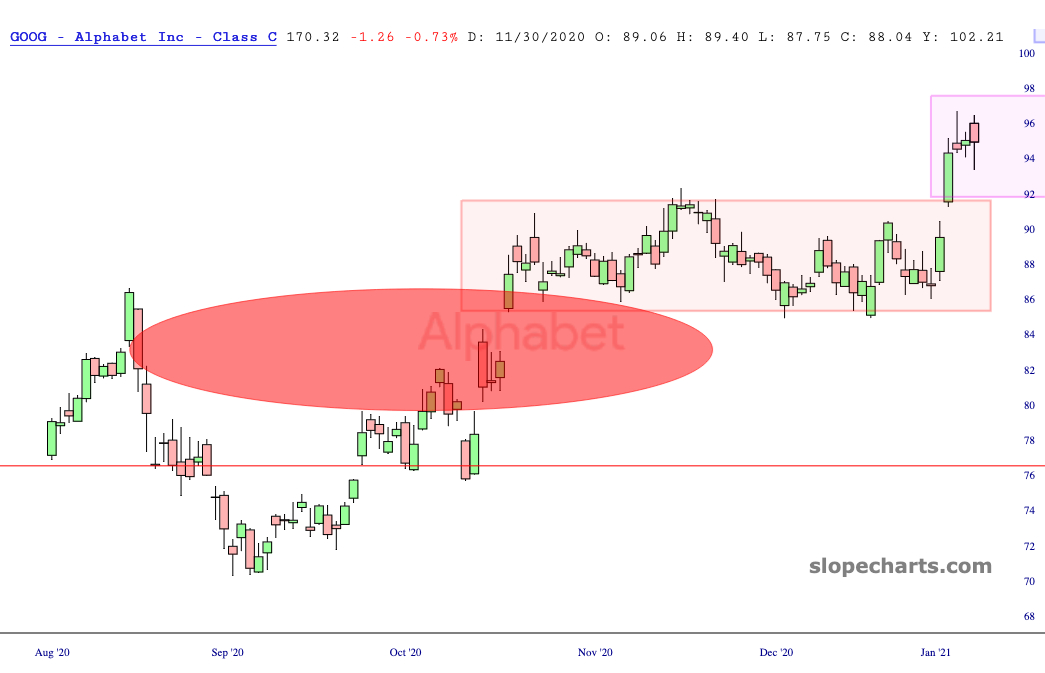
I count 9 balance areas on the daily chart (Exhibit 1) and I penciled them while drinking coffee, without taking too much time to find them. There are probably more than this on the daily time frame
Inspect both the eerily similar V bottoms of 2020 and the larger 4 year long V bottom that ended now in 2024.
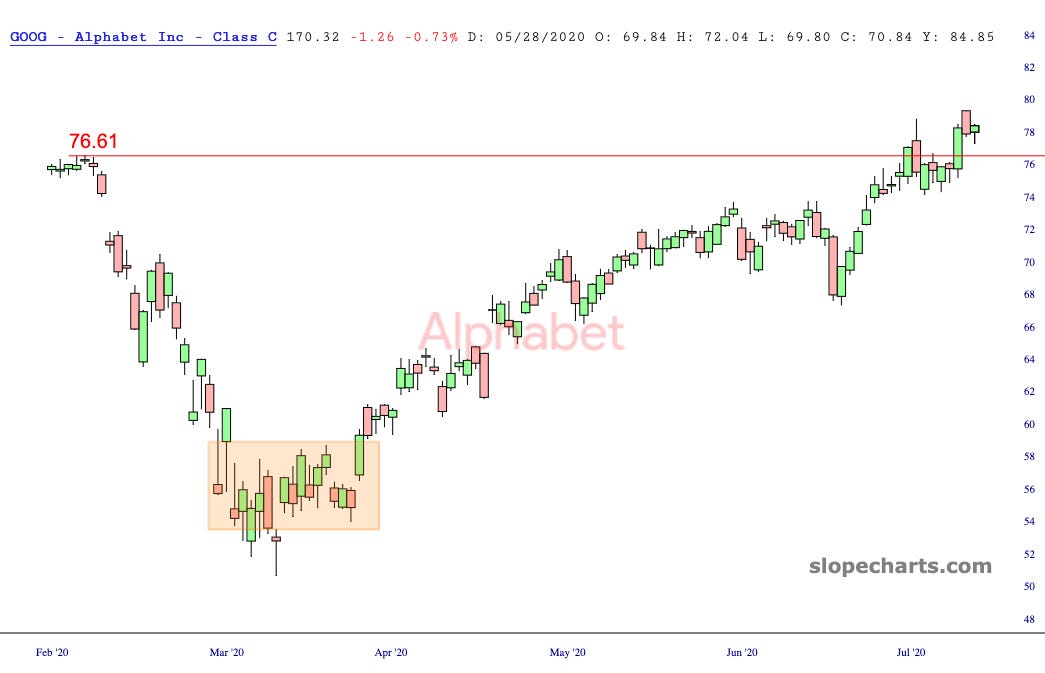

If the fractal pattern holds true, we may move sideways to create a balance area just like we did in October 2020 to January 2021, before we break up higher. The measured move from the Dec 2020 gap was 50% gain, which could theoretically translate to a move to $246, from the current April 26 gap.

Conclusion
If the stock market has one final push left in 2024 while it remains captive for election purposes and the prospect of rate cuts, we could see a phenomenal rise in shares of AI related and Mag 7 names before the plug gets pulled on this rally in 2025, as the Fed finally cuts rates too late.
I can find a multitude of data points that support the counter argument that the Fed cannot cut and the markets should be tanking. But our job as traders, investors and speculators is to manage risk in various time frames. To consider all outcomes and prepare.
But if in the case of a final run up and the last dance at the party situation unfolds, could we see another 50% rise by 2025 in shares of Alphabet?
Impossible you say? We already doubled from Jan 2023!
Time will tell. This fractal can also be a 404 not found.
I hope you enjoyed this session in front of the crystal ball!
Like ❤️ this piece or this genetleman will be back for you!

Addendum
I am changing the theoretical move to 50%, as I am measuring from the gap up from Dec 2020. Which would be 50% higher from the recent gap at $164.50, culminating at potential move to $246.
Here are the remaining Mag 7 charts in identical time frame as GOOG above. While they are all higher fantastically (except TSLA) in that same period, they do not exhibit the same fractal pattern.


