


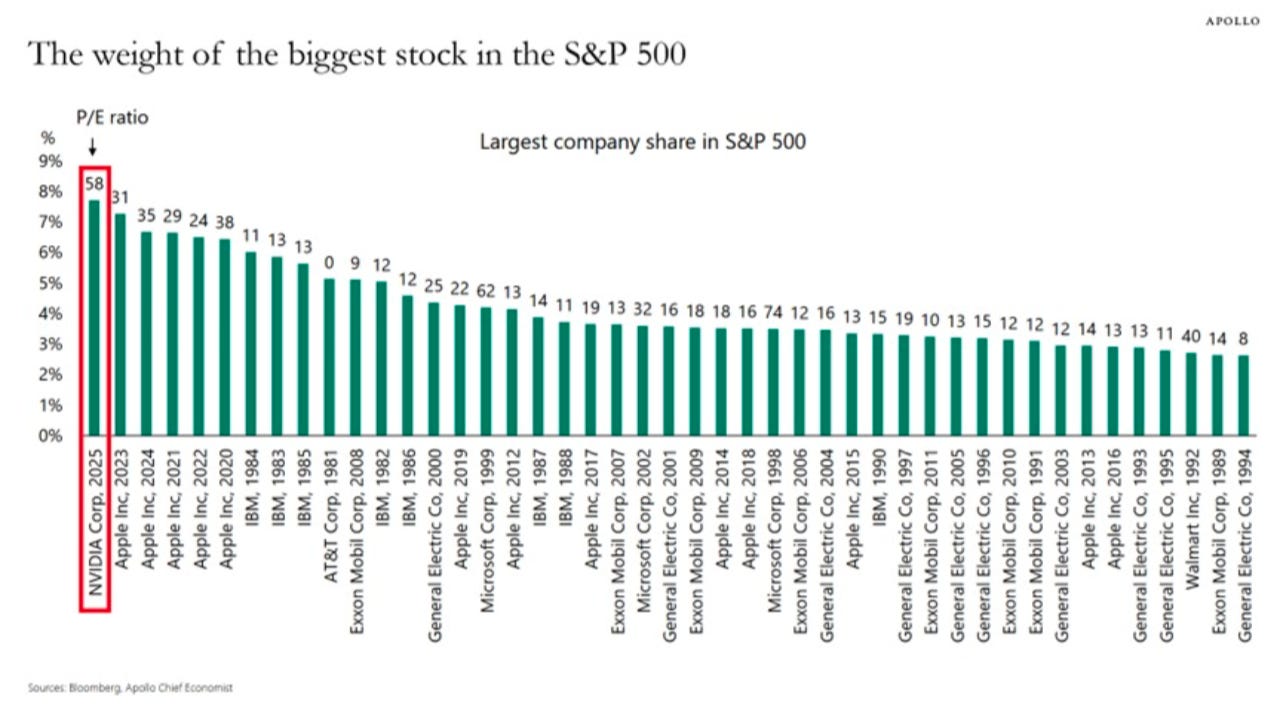
I have shared the component % of the indices many times. But check this out ...
Nvidia, $NVDA, now accounts for ~8% of the S&P 500, the highest for any individual stock since records began in 1981.
The only other company to exceed 7% in the past was Apple in 2023.
Not even the 2000 Dot-Com Bubble saw a stock dominate the S&P 500 to this extent.
For example, in 1999 and 2000, Microsoft and General Electric each accounted for ~4% of the S&P 500.
Furthermore, IBM's record share of the index was ~6% in 1984.
Source : The Kobeissi Letter
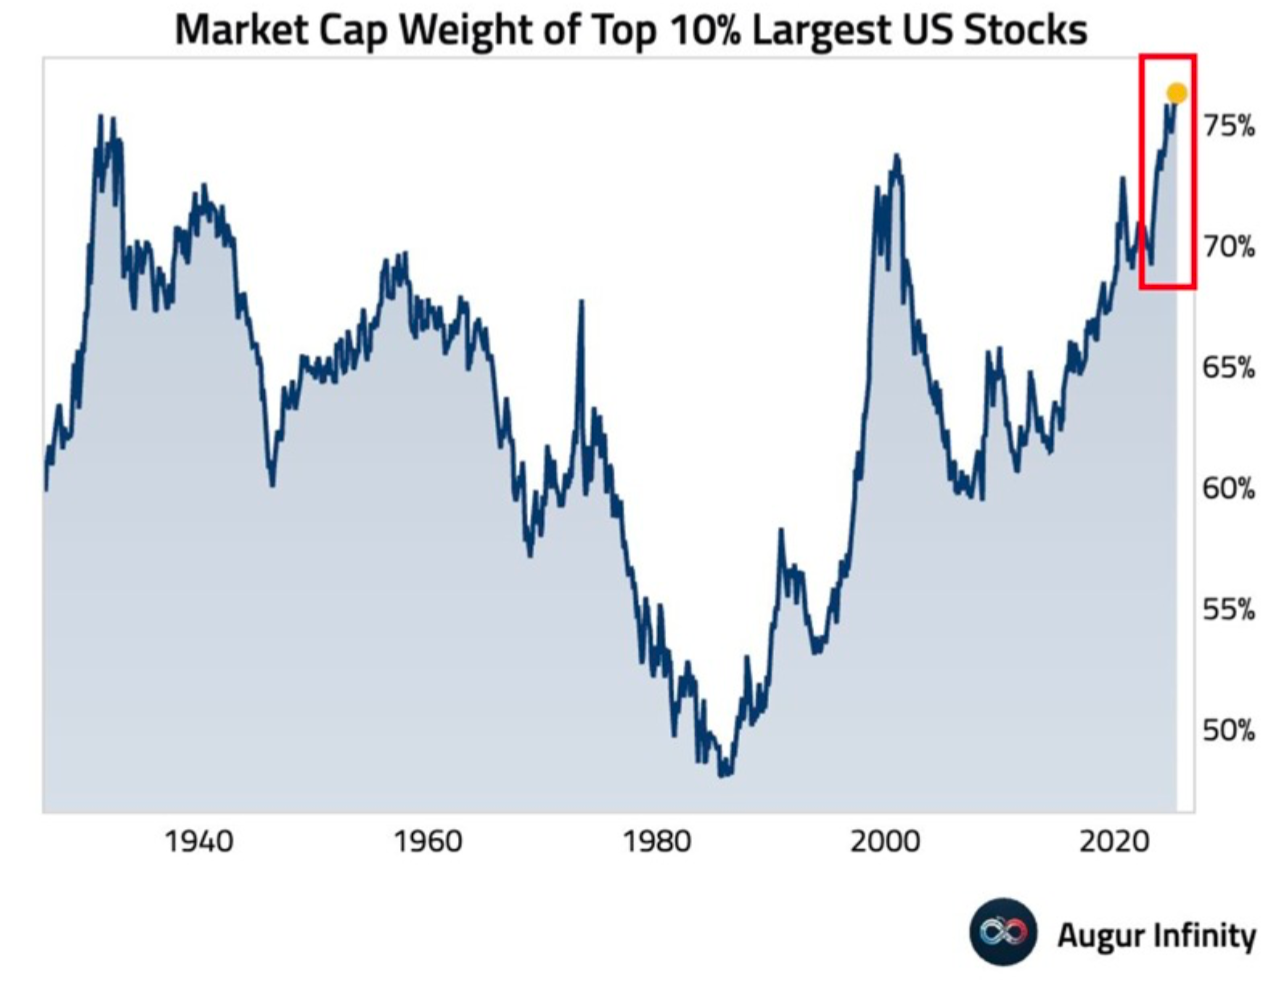
“It's official:
The top 10% largest US stocks now reflect a record 76% of the US equity market.
This has officially surpassed the previous record set before the Great Depression in the 1930s.
By comparison, at the 2000 Dot-Com Bubble peak, the top 10%'s share was at ~73%.
In the 1980s, this figure was below 50%.
Meanwhile, the top 10 stocks in the S&P 500 now represent a record 40% of the index’s market cap.
We are witnessing history.”
The Kobeissi Letter
$SPY $QQQ $TQQQ $SQQQ #AI
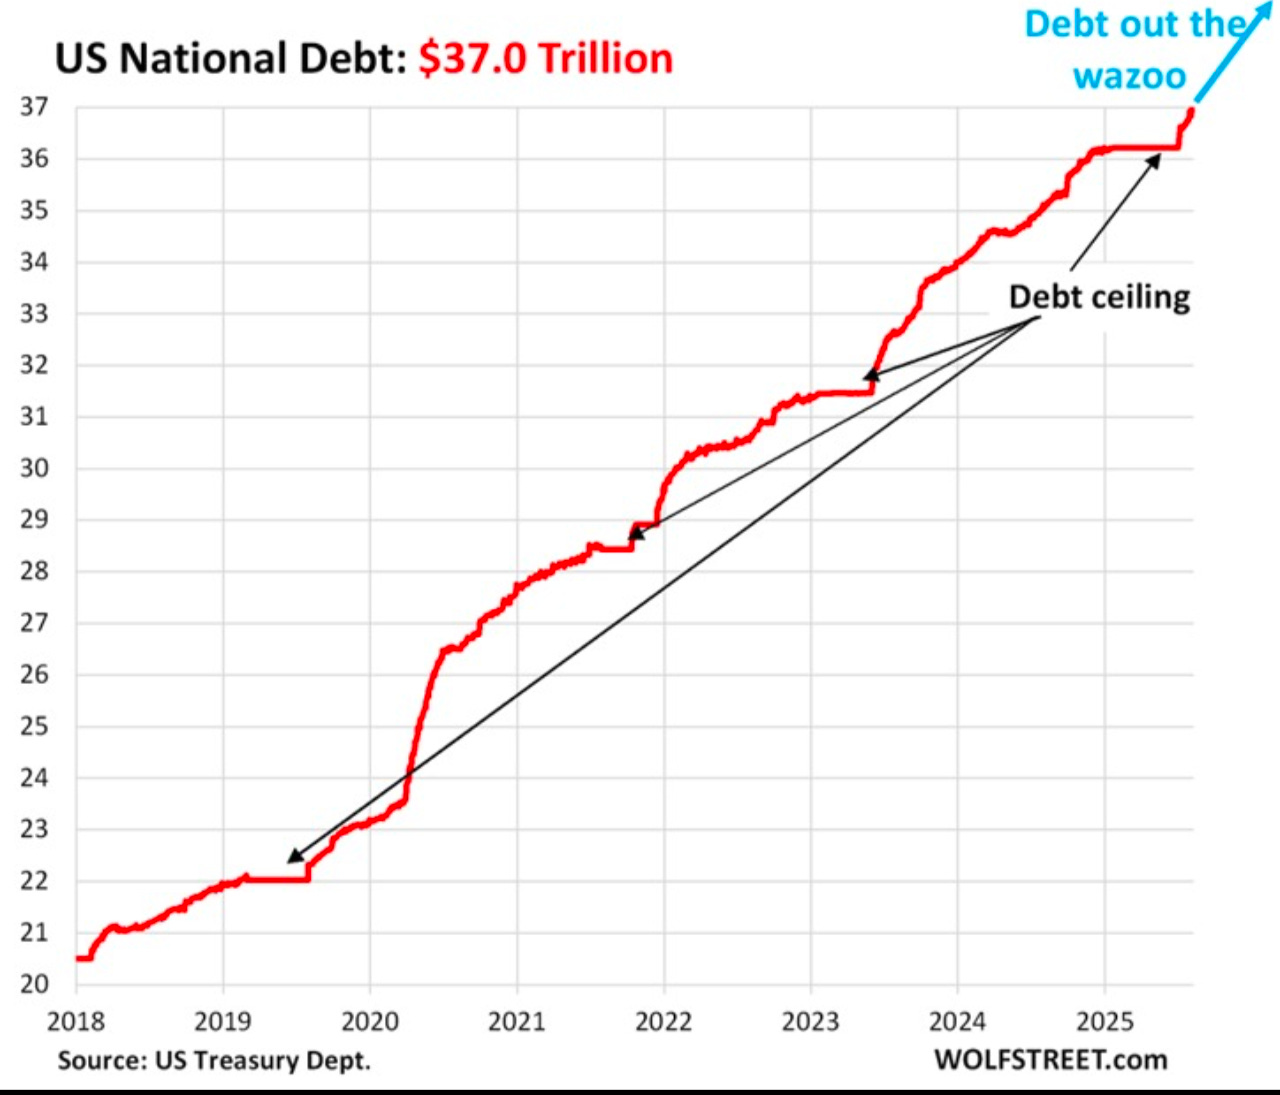
Total US debt has officially crossed above $37 trillion for the first time in history.
This puts total US debt up +$780 billion since the debt ceiling was raised following the signing of the "One Big Beautiful Bill Act" into law on July 4th.
This equates to an average rise of a whopping +$22 billion per day.
Last week alone, the government sold $724 billion in Treasuries through 10 auctions.
Easy way to get free comp or add free months to paid membership via referrals.

Unlocked full daily podcast episodes
Premium only Stock Spotlights
Break out and breakdown watchlists
Concierge intraday alerts and private group chatroom
Member Chart requests
Educational content to learn how to read the markets using breadth, macro and technical analysis through the lens of Auction Market Principles
Free Preview: 3 min
Full Episode: 11 min
Please remember to ❤️
or the 🥷 will find you!
🎧 Podcast Available on all major platforms: Spotify | Apple | Amazon
👉 Recommended Chart Software at Slope Charts