NVDA Reactions to its 100 Day Moving Average
The above video is a screen grab showing how easy it is to tailor a moving average to a stock chart using a slider or text input via SlopeCharts. The slider is helpful if you want to dynamically see which moving average (MA) or simple moving average (SMA) a stock tends to find support and resistance at, rather than just using standard values like 21, 50, 100, 120, or 200.
You can read more about SlopeCharts and sign up with an exclusive discount for the community.
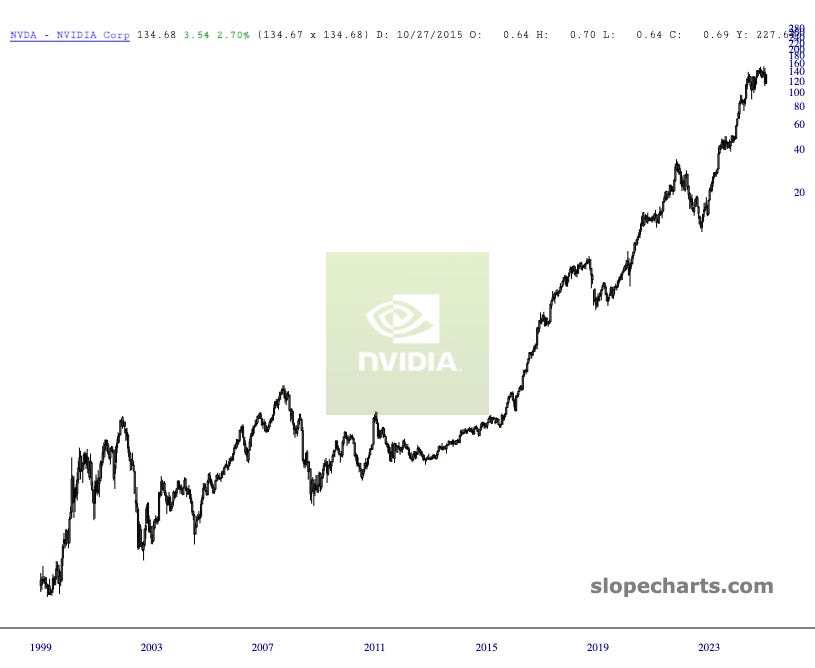
For this use case, let's see how NVDA has reacted to its 100-day MA, both on the downside and the upside.
(Lifetime Log Scale Chart of NVDA)