Home Builder Stocks Only Go Up! Right?
We are witnessing either a perfect deleveraging and soft landing, or the beginnings of a blow off top in Housing. You be the judge. Below you will see the charts of the major home builders and videos of on the ground tours of multiple cities.
The CPI report came out today and it seems there will be no rate cuts that Wall St and corporate America needs so badly to rollover debt.
10 Year Yield went from 4.184 Monday to 4.27% on Tuesday
The BTFP is supposed to end in March
Mortgages are still double from the beginning of the pandemic
Home prices are starting to fall but everyone is waiting for Spring data for trends in inventory, prices and mortgage applications.
I myself am on the sidelines waiting to buy my “Dream” home. I refuse to get suckered into this market for a home that costs 7 figures. So I wait until New housing starts falls below 800k.
Premium Members keep scrolling…
Would love to hear your thoughts on below charts of builders and local walking tours of new home construction.
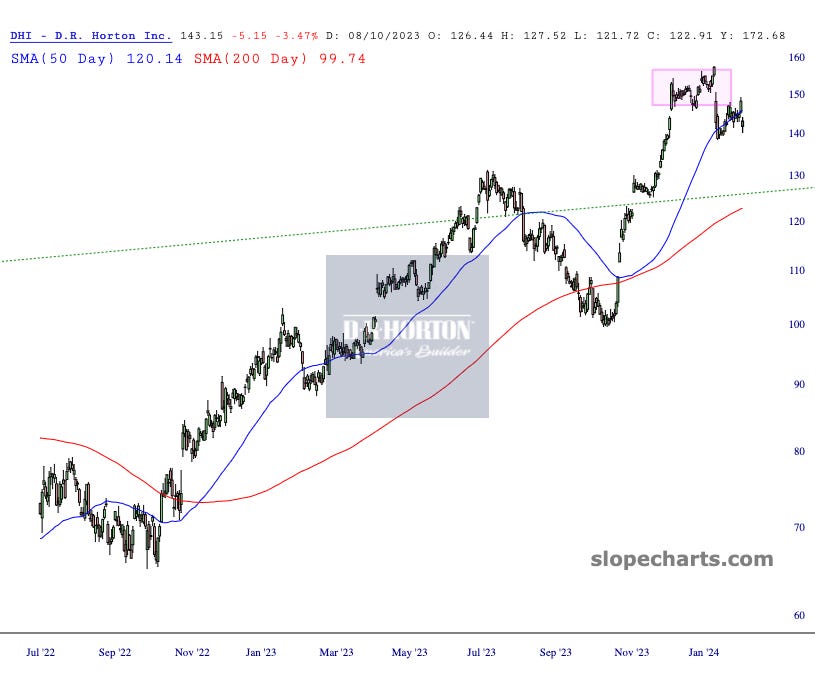
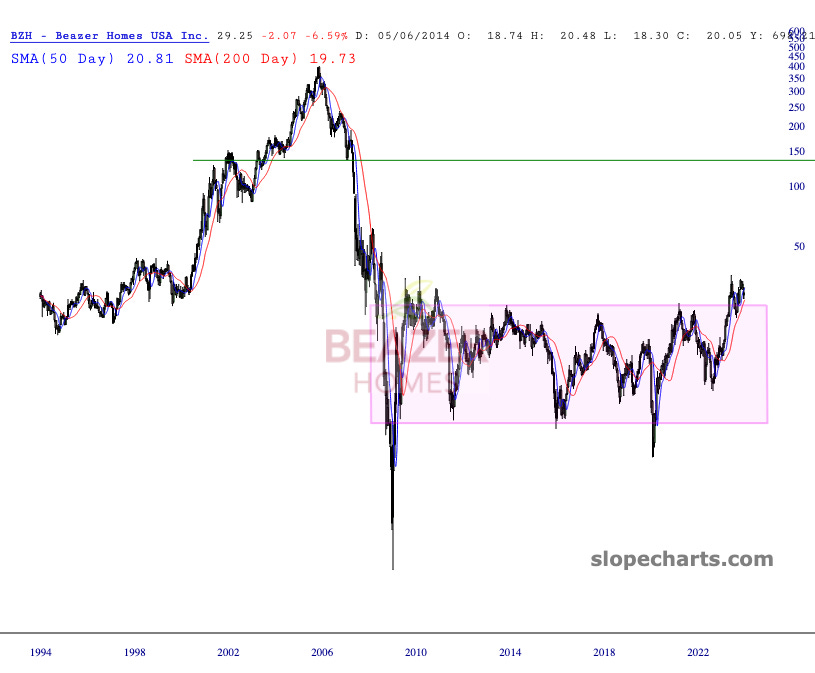
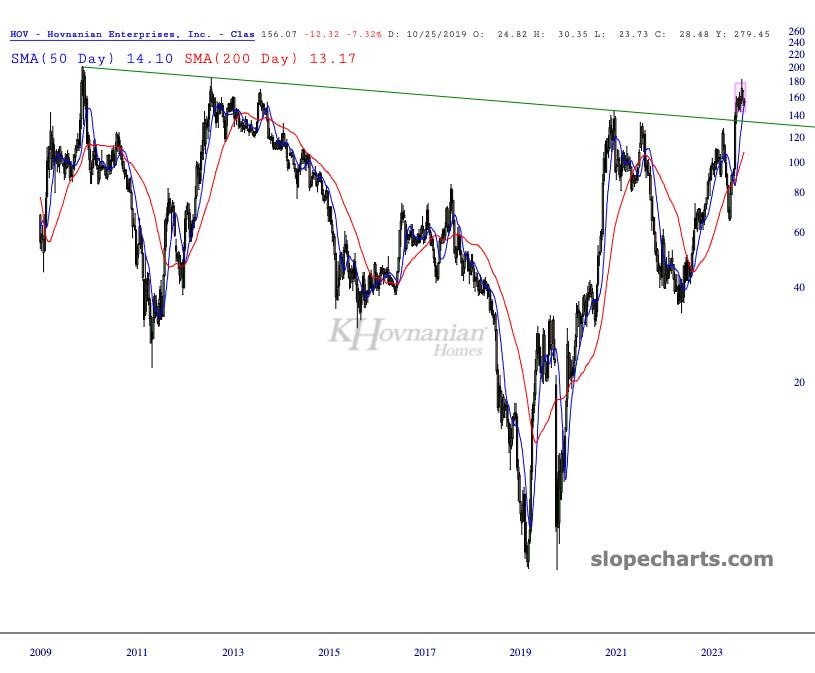
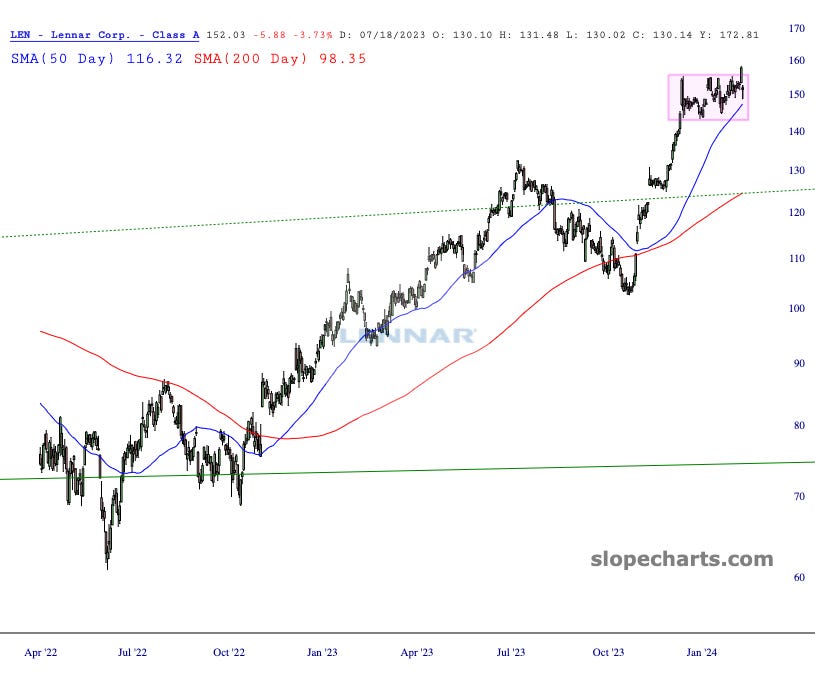
We are seeing a blowoff top it seems on builders. They can certainly keep going higher as a group, if rates fall and thus mortgage rates fall. Or if inventory spikes due to distress and prices going lower. But one of these are lying. Either the homebuilder prices or the fact inventory is plentiful if you count the unlisted new builds going up all over the country.
TOL 0.00%↑ is setting up to break up or down from this balance area. What is very nice here is the tight range. You can go long or short when prices vacate the range, with a tight stop for either position at $102
DHI 0.00%↑ already brown down from its range and is failing the 50 day ma
BZH 0.00%↑ had a beautiful longer term range that it broke out of, but is trying to backtest before going higher, or it will fail back into this larger range
HOV 0.00%↑ is also in a tight range above its long term break out. It will either fly like NVDA or fall back below this green trendline
Similar picture with LEN 0.00%↑
Are you starting to see the trend? PHM 0.00%↑
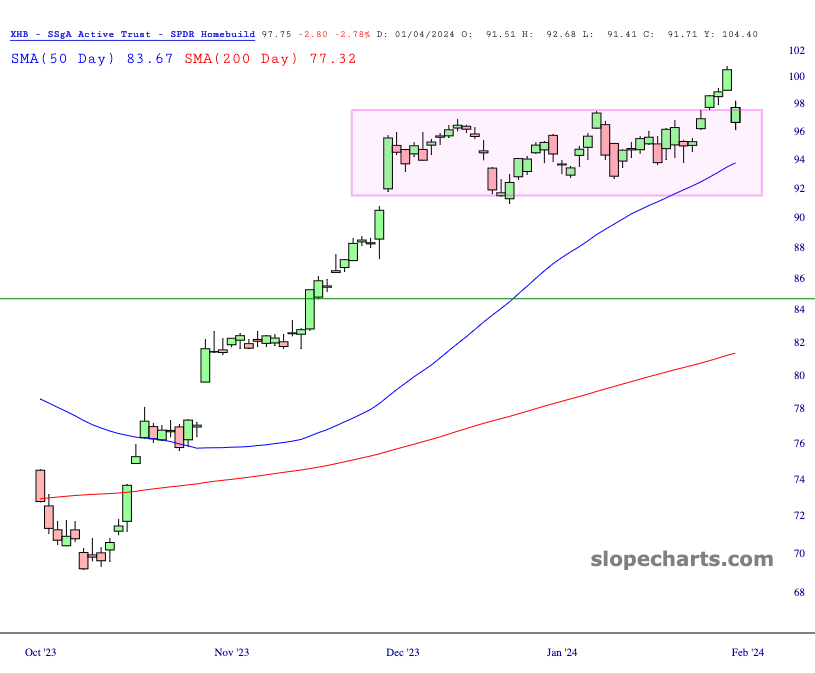
The Home builder index XHB 0.00%↑ already broke out, backtested and failed
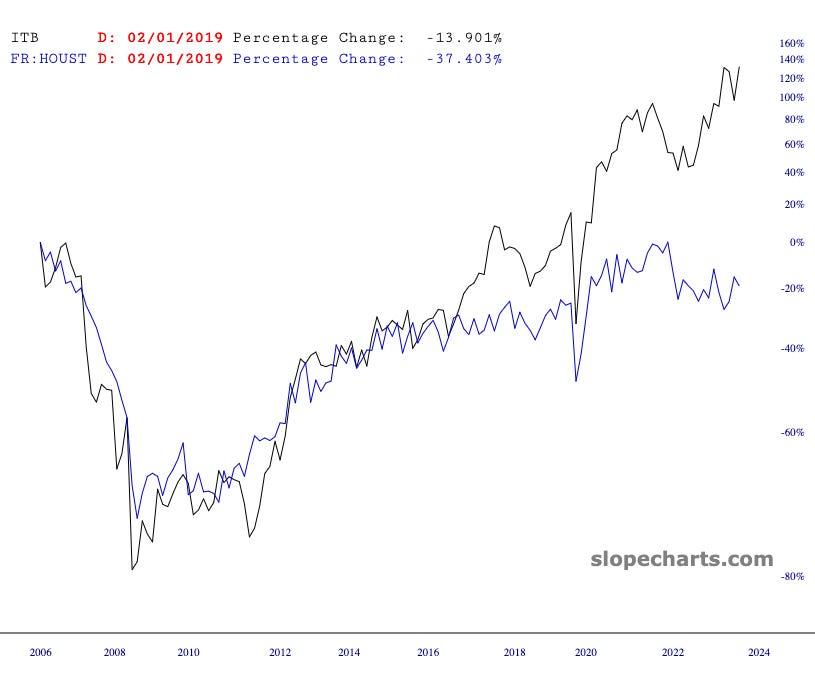
Here is a performance comparison chart of ITB 0.00%↑ and new housing starts. Look how closely they traded until after 2016. I would surmise this spread or delta will close with either new housing starts rocketing even higher to meet ITB, or ITB falling hard to meet new housing starts, or a little bit of both to close the alligator jaws.
And here are all of the Boots on the ground tours of new home builders.
Who is lying?
Raleigh NC Boots on the Ground - Real Estate Report “It’s Over New Home Disaster”
Added Feb 12th, 2024


