
Gold & Silver - Shiniest of the Bunch
Almost all silver and gold related look similar… massive breakouts. But some have better price location than others.
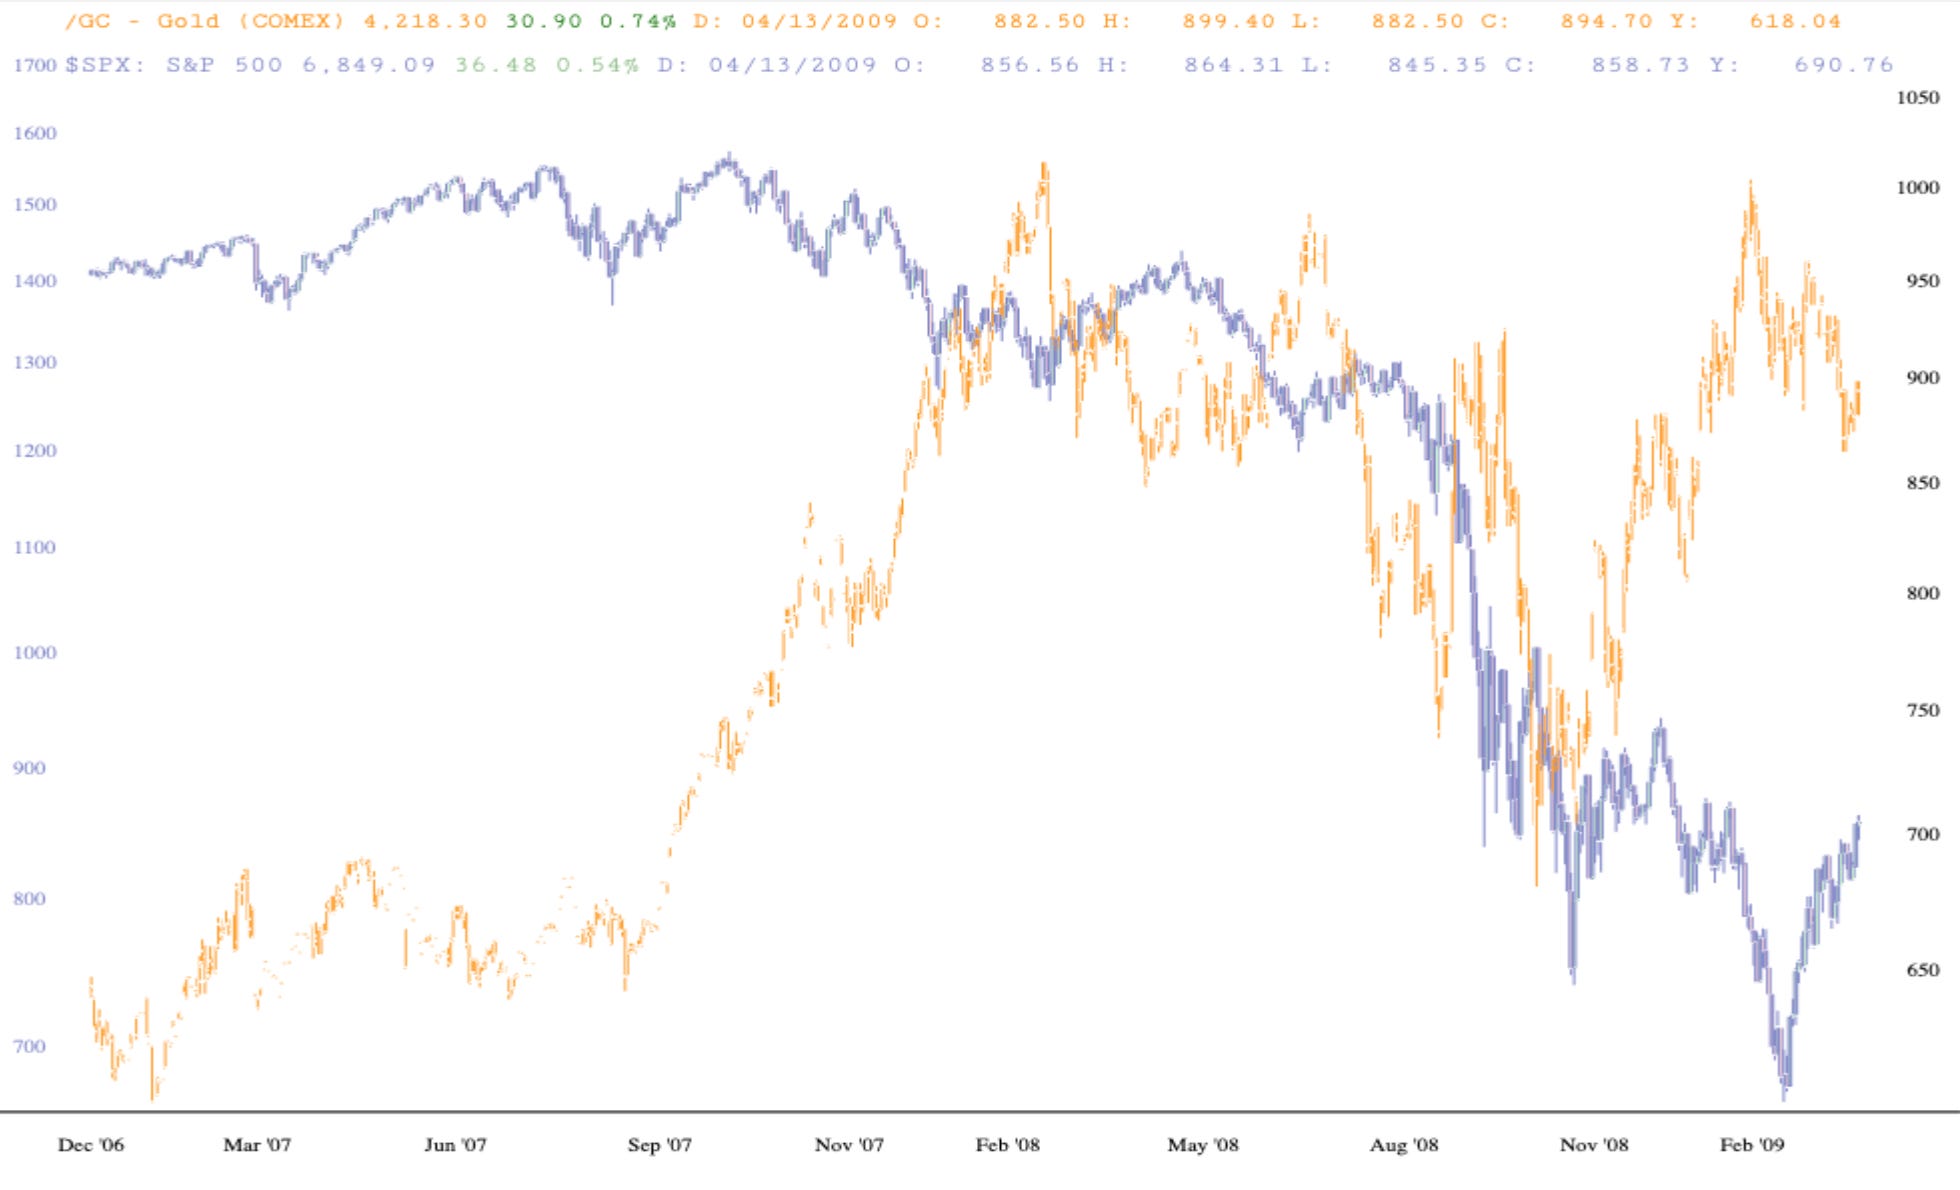
I also would like to remind everyone that Gold and precious metals fell along with equities during the initial fall of the GFC, but gold bottomed first. So in the near term horizon there are potential risks.
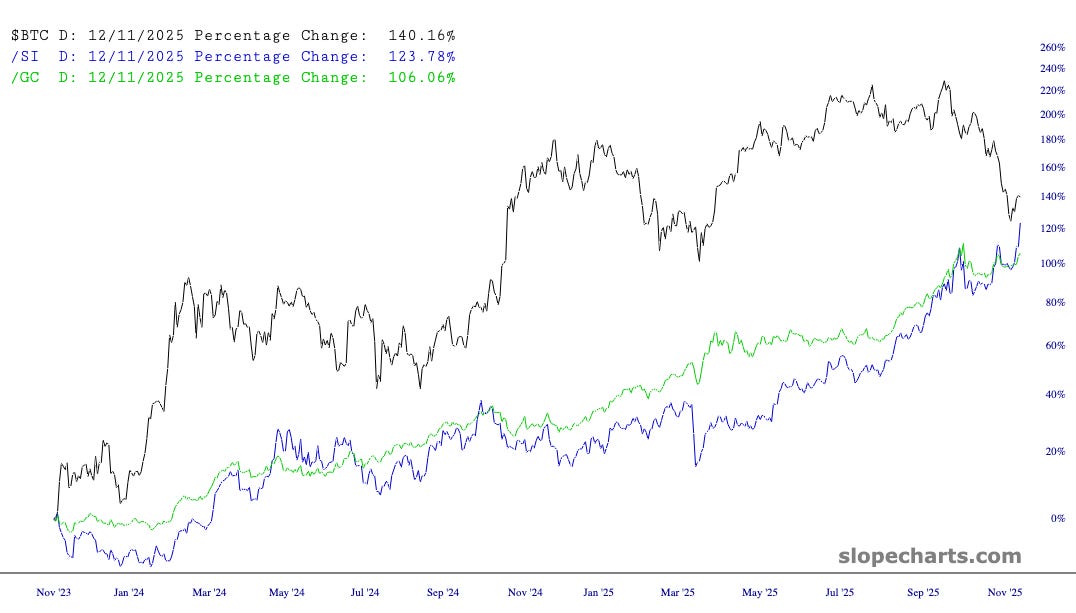
Another interesting view is 2 yr chart of Bitcoin, Silver and Gold. Baton changing hands?
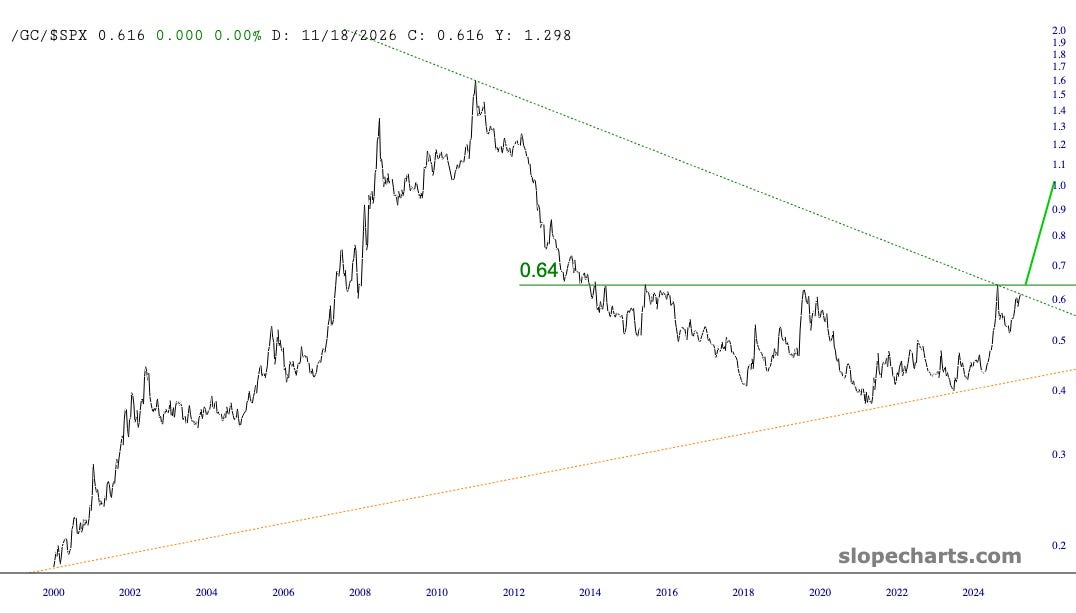
Last macro view. Here is Gold vs S&P 500 ratio chart. Since 2010 the S&P beat Gold, but it seems this is also beginning to flip. Gold is up 63% YTD, Silver 96%, SPY 16%.
Watch that 0.64 line and the descending trendline. It doesn't have to break out. Always be open to opposing outcomes.
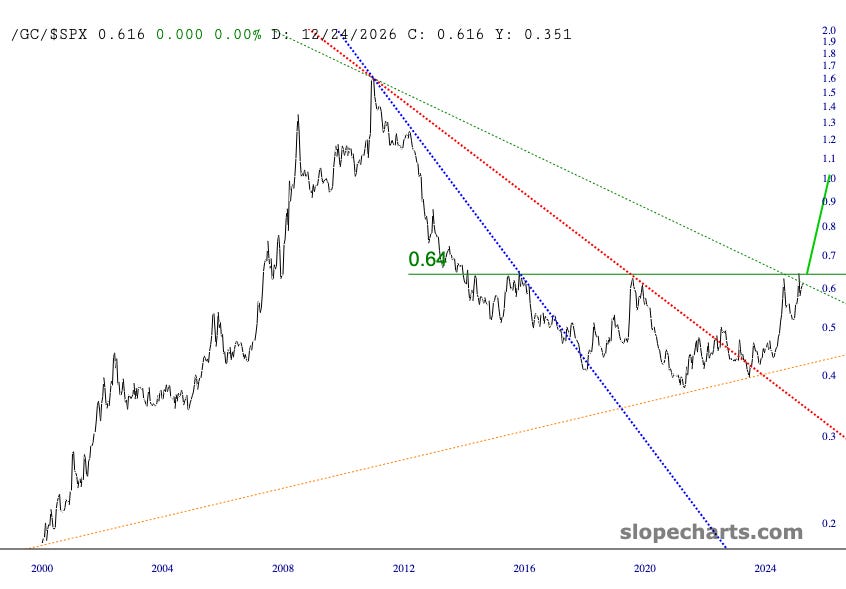
Same chart below, but different descending trendlines! The previous two breakouts failed (red and blue). And keep in mind there are many games being played at the CME and Wall St with shorts and suppression of Paper Silver.
The first standout is Barrick, a major miner.
Barrick has already doubled since it broke out of it’s base and is approaching previous highs from 2007 and 2010. Will there be enough runway to finally break above 41.39?
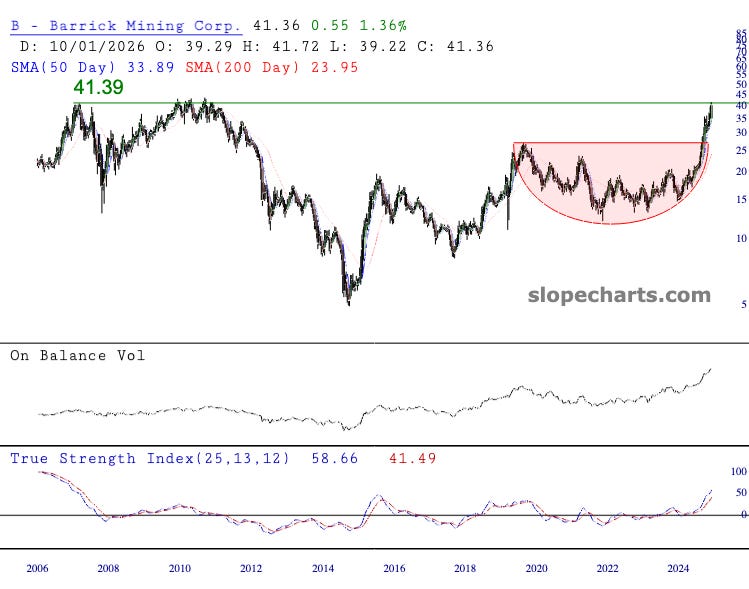
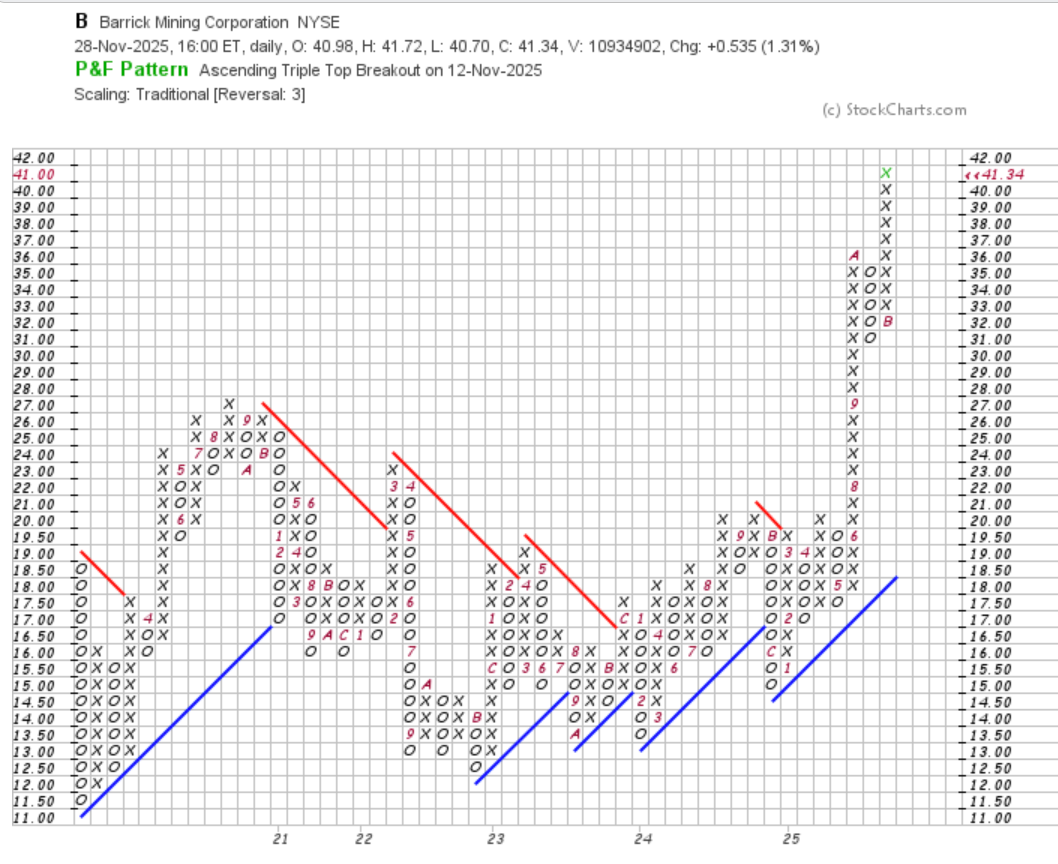
The P&F clearly shows the stock is out of balance and seeking a higher auction where buyers and sellers can facilitate more trade. Like all precious metals at the moment, it is trading initiatively higher.
Let’s continue to the remaining stand outs: