


Do the opposite of the herd
“My name is George, I am unemployed and I live with my parents.” So so good!
101 Lesson/Analogy for Moving averages
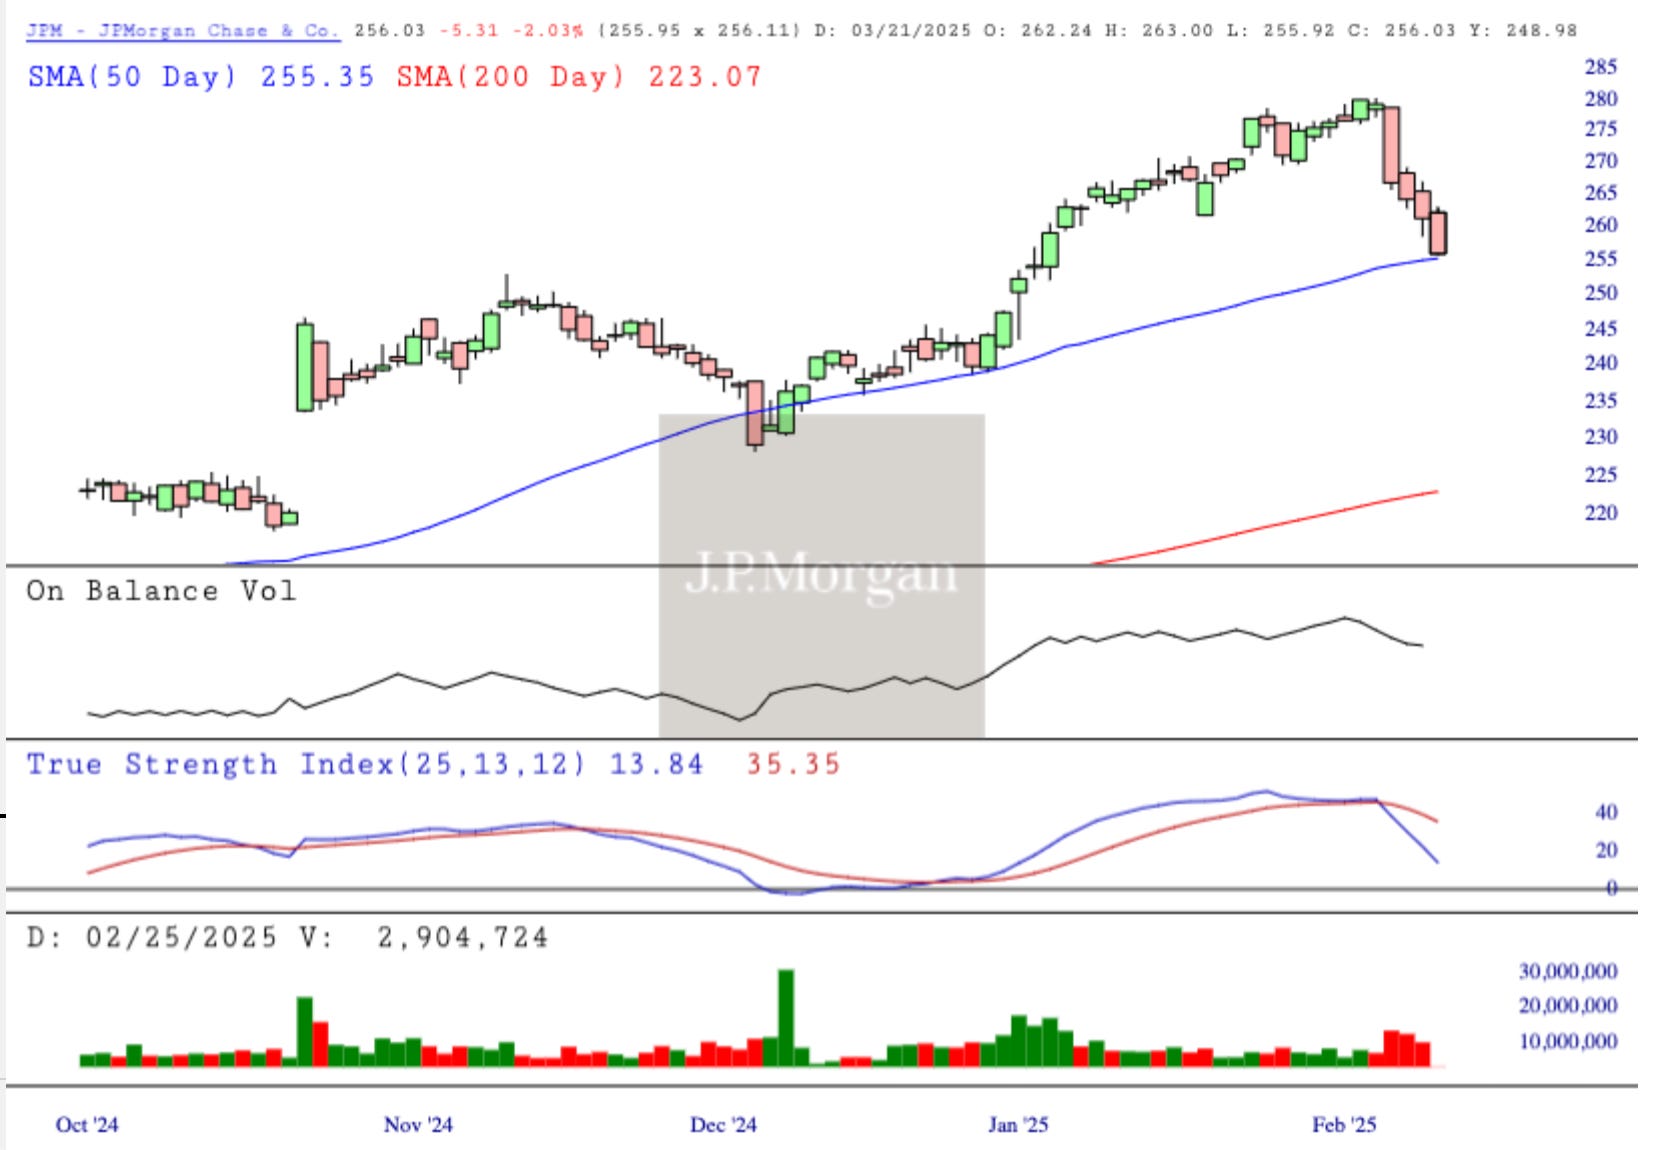
If you are new to technical analysis or stock charting, when you see moving averages and are confused how to use them, I offer an analogy. Next time you are at a traffic light driving your car, the 2nd largest intersection in your town is the 50 day moving avg. The largest intersection like your main st, is the 200 day moving avg. The stop signs are the 21 Day EMA.
Let’s take a look at JPMorgan’s JPM chart. right at the 50 day ma $255
What should happen is defense. If that happens don't be surprised. What shouldn’t happen is it blows right past the 50 day on volume. That would be like all the cars in your town running a red light, fire trucks with sirens directing everyone to run the light for an emergency.
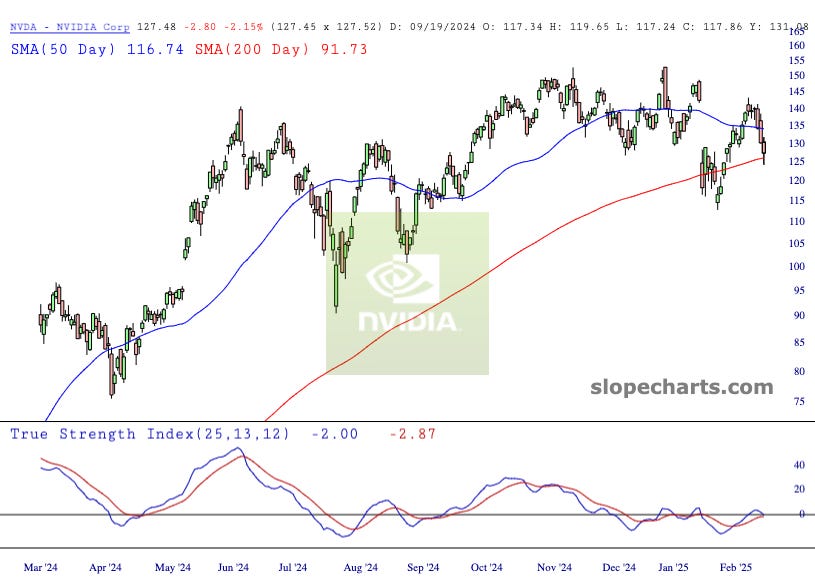
And how about NVDA? Already broke below the 50 day and the 200 day. Awaiting earnings right at the 200 day ma. Good luck!
Topics I will cover tonight
Macro
What was up and down in the S&P and Nasdaq
Mag 7
TSLA Short
My main positions and thoughts heading into NVDA earnings
Bill Cara’s email to me re LQD vs TLT
Free Preview: 5 min
Full Episode: 24 min
🎧 Podcast Available on all major platforms: Spotify | Apple | Amazon
👉 Recommended Chart Software at Slope Charts


